
Formula and inputs
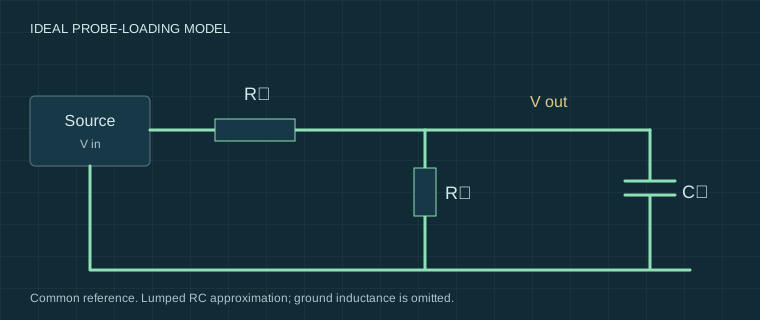
A = 1 + Rₛ/Rₚ; B = 2πfRₛCₚ
|H| = 1 / √(A² + B²)
phase = −atan2(B, A) × 180 / π
The transfer function is H = 1 / (1 + Rₛ/Rₚ + j2πfRₛCₚ). Amplitude ratio compares the loaded voltage with the ideal source’s unloaded voltage; negative phase means lag. Source resistance, capacitance and frequency may be zero; probe resistance must be positive. The defaults are illustrative values, not a specification for your probe.
Worked example
At DC, Rₛ = 10 kΩ and Rₚ = 10 MΩ give 0.999001 amplitude ratio and 0° phase. With Cₚ = 12 pF at 1 MHz, the ideal result is about 0.798 amplitude ratio and −37.0° phase.
What the model leaves out
This linear lumped RC model excludes ground-lead inductance, transmission lines and the complete instrument frequency response. It does not predict overshoot, nonlinear circuit changes or probe safety. Use documented combined input values appropriate to the probe and scope arrangement.
Sources and their limits
These references support the principles described here. External tests remain the original authors’ work. Check the exact model manual before connecting equipment.
- Meettechniek — Oscilloscope probes ↗Independent explanation and experiments on probe loading and compensation; the author’s equipment and conditions apply.
Reviewed for this edition on 22 September 2026. How we use evidence →